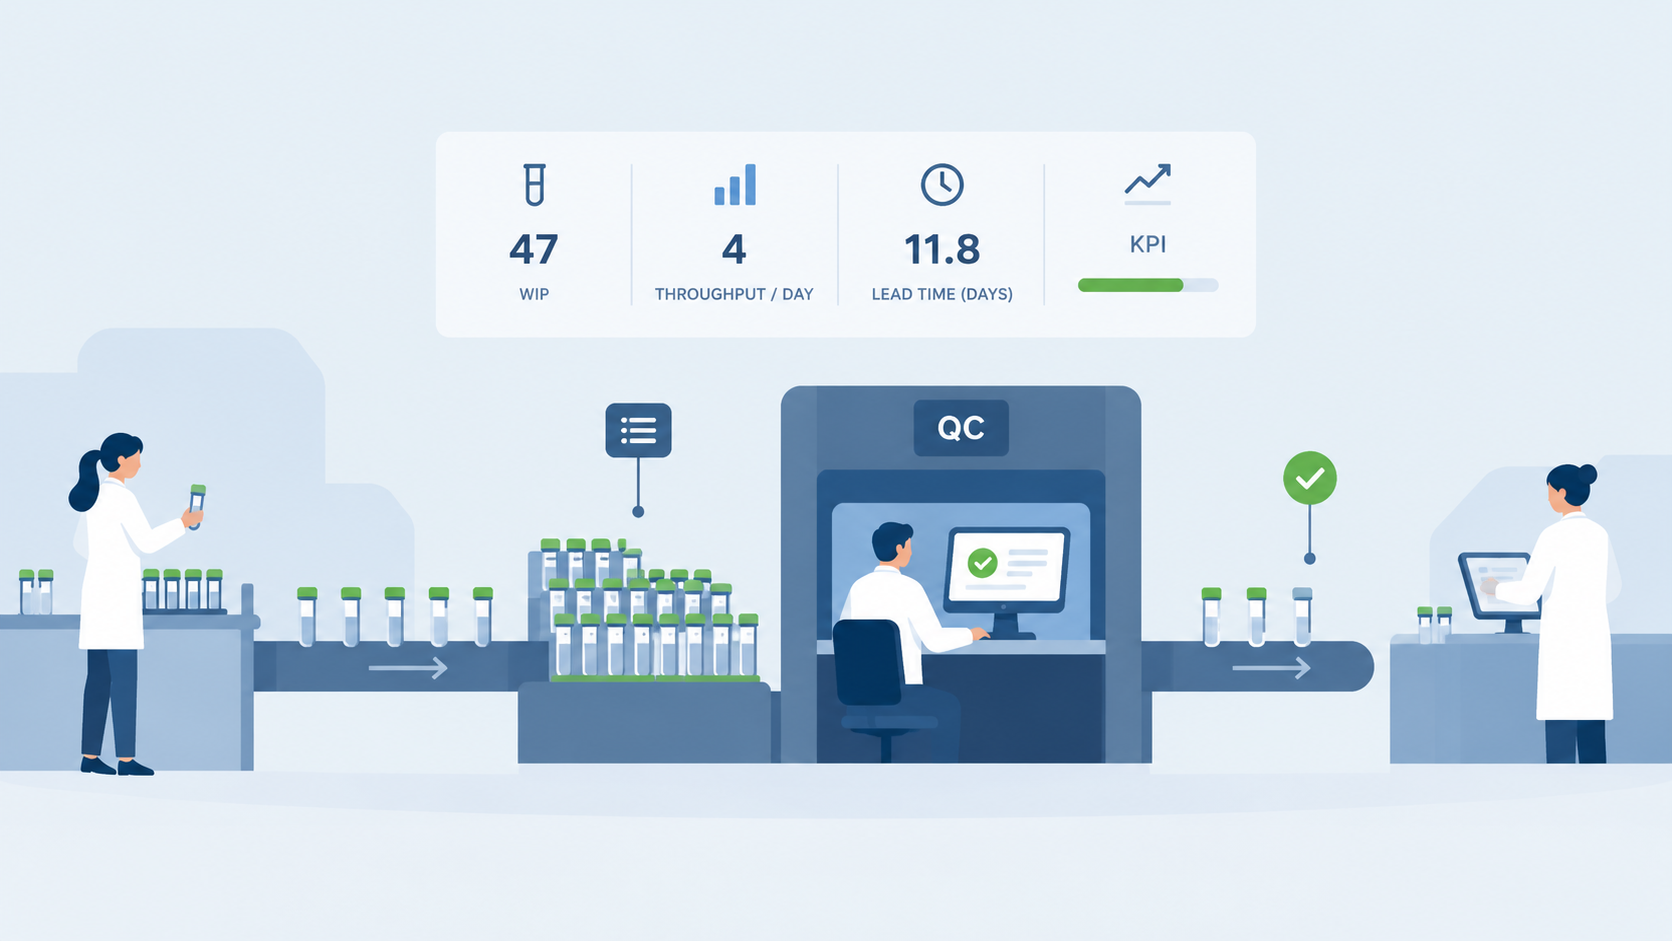

Every QC lab knows the handover board on a Tuesday morning. 47 samples on the priority list, 43 yesterday, 38 the week before. Utilization is high and most deadlines are still met, so on paper the lab is running. Still, the team will stay late tonight, and next week the list will be longer. Nobody on this team is lazy, and the lab head is not a bad leader. The system they work in produces this result by design, and no amount of effort changes that.
“A lab head watches the sample backlog grow for the tenth week in a row. Utilization is high. Deadlines are mostly met. And yet everyone knows Friday will end in overtime again. This is not a motivation problem. It is pure math.”
The symptom everyone sees, the cause almost nobody names
Backlogs grow. Lead times stretch. Someone stays late to rescue the week, again. Leadership reads the situation and reaches for the obvious lever: push harder, add pressure, ask for more flexibility. It feels responsible. It feels like leadership.
But it actually makes things worse.
Not because people stop trying. Because the system they are working in obeys rules that have nothing to do with effort. Those rules are not opinions or management philosophy. They are mathematics, and unfortunately mathematics does not respond to a motivational speech.
Little’s Law tells you why your lead times keep drifting
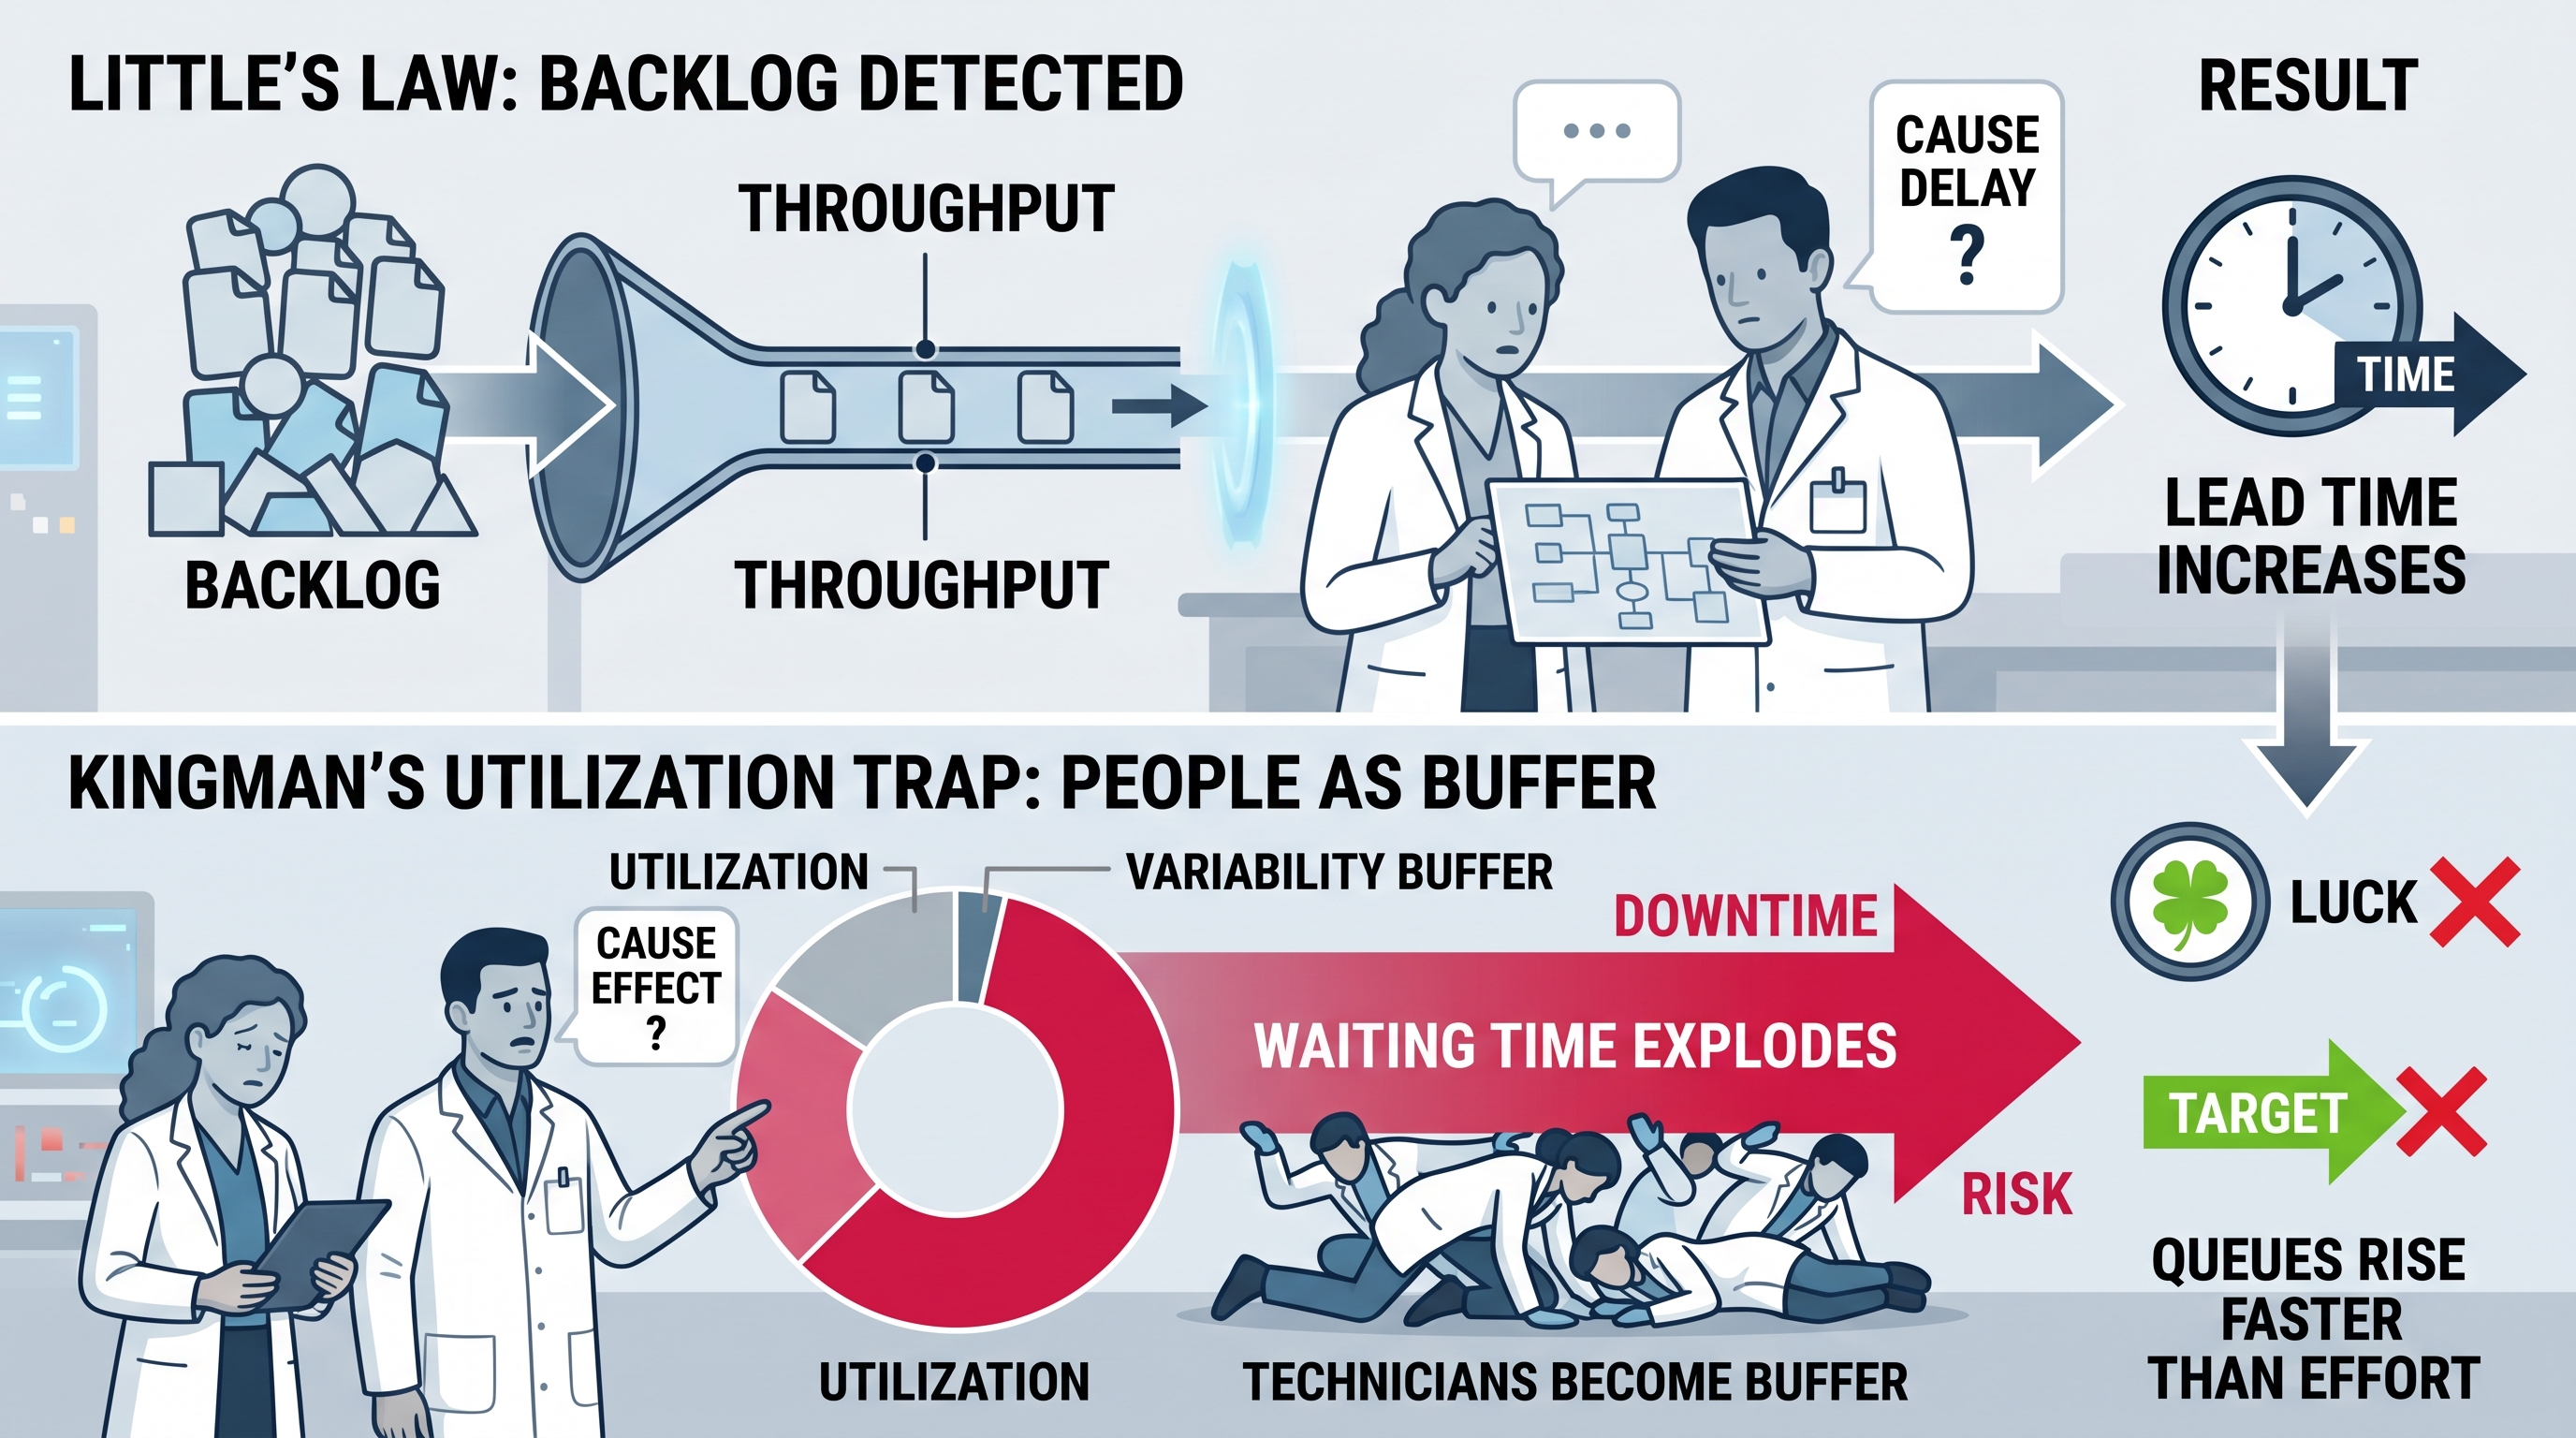
Lead time equals backlog divided by throughput. That’s it. That’s the whole relationship, and it is always true. If backlog doubles and throughput stays flat, lead time doubles. No exceptions, no workarounds.
Most quality organizations try to fix lead time by asking people to work faster. But throughput rarely moves that way, and backlog keeps climbing because demand doesn’t pause for your improvement initiative. The lever that actually works is structural: reduce what’s waiting, or increase what completes. Pressure on individuals does neither.
Kingman’s formula explains the wall you keep hitting at 95% utilization
Here is the part that surprises most leaders. A system running at 95% utilization does not perform slightly worse than one running at 85%. It can carry up to ten times the waiting time. Small increases in busyness produce disproportionate increases in delay, because there is no slack left to absorb variability: rework, urgent requests, the unexpected sample.
“Doing more with less” sounds efficient. In a variable system, it is however the fastest way to guarantee longer queues. An operation running at 85% utilization, with real breathing room, will often outperform one running at 95%, because it can actually flow instead of choke.
Due dates optimize promises, not performance. Deadline-driven management creates a predictable chain: work starts late to maximize parallel load, parallel work fragments attention, and overtime compensates for a mess that was never a capacity problem in the first place. Multitasking alone can cost up to 40 percent of productive time. The harder you push, the slower the system goes. Not a figure of speech. A property of the system.
The uncomfortable fix: protect the buffer, don’t punish it
A rising backlog with stable output is not a warning sign. It’s a system absorbing volatility the way it’s supposed to. A shrinking backlog achieved through overtime is the opposite: a system quietly consuming the people inside it. Once leaders can tell these two situations apart, the instinct to “just push through” starts to lose its grip.
This is where most quality operations get stuck. They can feel that something is structurally wrong, but they lack a shared language to see it, measure it, and defend decisions that look counterintuitive from the outside, like deliberately letting a backlog grow.
Where q_alizer fits in
This is exactly the gap q_alizer closes. Data Channels pull throughput, lead time, and backlog trends directly out of your existing systems, so flow becomes visible instead of guessed at in a status meeting. Cockpits translate that data into the signals leaders actually need: is utilization eating your buffer, is variability increasing, is a queue building at a specific handover. Insight Agents flag the leverage points, the constraint that’s actually driving delay, not the ten symptoms downstream of it. None of this replaces judgment. It replaces guessing.
Flow is a system property, not an individual achievement. No single role fixes it alone, and no amount of individual heroics will substitute for a system designed to stay stable under pressure.
This article covers the physics. The full picture, five layers deep, including how to read variability, design for it with ABC/XYZ segmentation, and what leaders concretely do differently once they stop managing effort and start managing flow, is laid out in our whitepaper, The Harder You Push, the Slower You Go.
Download the whitepaper and see why the right amount of backlog might actually be the healthiest number on your dashboard.